
Set up monitoring before your Proxmox host melts down at 2am.
Grafana + Prometheus + AlertManager in an LXC container with Telegram alerts. No agents on the host — pure API-based.
Why Bother Monitoring Proxmox?
Without metrics, problems are invisible until something breaks.
Failures you won’t catch:
- Disk failure or ZFS degraded state
- Root filesystem full
- RAM/swap exhaustion
- Runaway VM hogging CPU
- Backups silently failing
- Node down after an update
- Compromised container mining crypto
Your storage won’t email you. Your node won’t text you. You find out when it breaks.
Design the monitoring system

How This Setup Works
LXC keeps things lightweight — no extra kernel overhead.
Proxmox side: Read-only API token on port 8006. No agents, no kernel modules.
Monitoring LXC (192.168.100.40):
- pve-exporter - Queries Proxmox API every 15s for node, VM, ZFS, and backup metrics
- Prometheus - Scrapes, stores 15 days of history, evaluates alert rules
- Grafana - Dashboards with ready-made templates
- AlertManager - Routes notifications by severity:
- Critical (node down, disk failure) to Slack
- Operational (high load, backup failed) to Telegram
What’s Good (and What’s Not)
Pros:
- Three services in one LXC
- ~2GB RAM total
- Read-only API token — safe by design
- Zero licensing costs
- Great dashboards out of the box
Cons:
- Single point of failure (mitigate with HA)
- 15 days retention (extensible)
- No built-in long-term storage (needs Thanos or VictoriaMetrics)
- Exposed to your network (use a reverse proxy if needed)
Fine for homelabs and small production. For 50+ nodes, scale up.
Prerequisites
Based on my local infrastructure:
- Proxmox VE 9.1.1
- Debian 13 LXC template in Proxmox
- Basic Linux knowledge
- Telegram account
- Slack workspace (optional)
Step 1: Create LXC Container
Create an unprivileged Debian 13 LXC for the Grafana stack.
LXC containers are the optimal choice for this monitoring stack, offering significant resource efficiency without sacrificing functionality.
Key Benefits:
- Lower overhead: LXC shares the host kernel, consuming ~50-70% less RAM than a VM (8GB LXC vs 12-14GB VM)
- Faster performance: Near-native CPU performance without virtualization overhead
- Quick startup: Container boots in 2-3 seconds vs 30-60 seconds for a VM
- Smaller disk footprint: 50GB LXC vs 80-100GB VM (no separate OS kernel/modules)
- Easy snapshots: Instant container snapshots for backup/rollback
No Feature Limitations:
- All Grafana stack components (Grafana, Prometheus, Loki, AlertManager) run perfectly in LXC
- Network services work identically to VMs
- No Docker required (native package installations)
- Full access to Proxmox API for metrics collection
Specifications:
- VMID: 140
- Hostname: grafana-stack
- Template: Debian 13 standard
- CPU: 4 cores
- RAM: 8GB
- Disk: 50GB (local-zfs)
- Network: Static IP 192.168.100.40/24
# On Proxmox host
pct create 140 local:vztmpl/debian-13-standard_13.1-2_amd64.tar.zst \
  --hostname grafana-stack \      # Container name
  --cores 4 \
  --memory 8192 \
  --swap 2048 \
  --rootfs local-zfs:50 \
  --net0 name=eth0,bridge=vmbr0,ip=192.168.100.40/24,gw=192.168.100.1 \
  --nameserver 8.8.8.8 \
  --unprivileged 1 \              # Safer unprivileged container
  --features nesting=0 \          # Nesting OFF - no docker will be installed in this container - container in a container
  --sshkeys /root/.ssh/your-key \ # injects your workstation keys
  --start 1                       # Start container after created
Result in Proxmox UI:
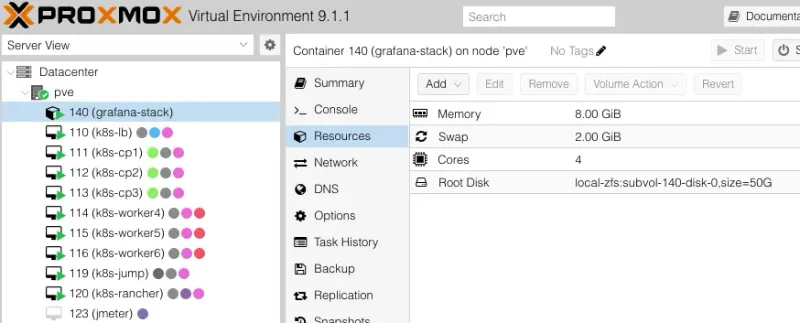
Step 2: Configure LXC Network
LXC containers don’t use cloud-init. Configure networking manually.
# Access container console via Proxmox UI or:
pct enter 140

# Configure network
cat > /etc/network/interfaces << 'EOF'
auto lo
iface lo inet loopback

auto eth0
iface eth0 inet static
    address 192.168.100.40
    netmask 255.255.255.0
    gateway 192.168.100.1
    dns-nameservers 8.8.8.8 8.8.4.4
EOF

# Restart networking
systemctl restart networking

# Verify
ip addr show eth0
ping -c 3 8.8.8.8
Step 3: Install Grafana Stack
Download grafana-stack-setup.sh or run:
# Update system
apt update && apt upgrade -y

# Install dependencies
apt install -y apt-transport-https wget curl gnupg2 ca-certificates \
  python3 python3-pip unzip

# Download installation script
wget https://gist.githubusercontent.com/sule9985/fabf9e4ebcd9bd93019bd0a5ada5d827/raw/8c7c3f8bf5aa28bba4585142ec876a001b18f63a/grafana-stack-setup.sh
chmod +x grafana-stack-setup.sh

# Run installation
./grafana-stack-setup.sh
The script installs:
- Grafana 12.3.0 - Visualization
- Prometheus 3.7.3 - Metrics collection and storage
- Loki 3.6.0 - Log aggregation
- AlertManager 0.29.0 - Alert routing
- Proxmox PVE Exporter 3.5.5 - Proxmox metrics collector
Takes ~5-10 minutes. Expected output:
=============================================
VERIFYING INSTALLATION
=============================================


[STEP] Checking service status...

  ✓ grafana-server: running
  ✓ prometheus: running
  ✓ loki: running
  ✓ alertmanager: running
  ! prometheus-pve-exporter: not configured

[STEP] Checking network connectivity...

  ✓ Port 3000 (Grafana): listening
  ✓ Port 9090 (Prometheus): listening
  ✓ Port 3100 (Loki): listening
  ✓ Port 9093 (AlertManager): listening

[SUCCESS] All services verified successfully!

[SUCCESS] Installation completed successfully in 53 seconds!
Step 4: Create Proxmox Monitoring User
Create a read-only API user on Proxmox for the PVE Exporter.
# SSH to Proxmox host
ssh root@192.168.100.4

# Create monitoring user
pveum user add grafana-user@pve --comment "Grafana monitoring user"

# Assign read-only permissions
pveum acl modify / --user grafana-user@pve --role PVEAuditor

# Create API token
pveum user token add grafana-user@pve grafana-token --privsep 0

# Save the token output!
# Example: 8a7b6c5d-1234-5678-90ab-cdef12345678
Save the full token value. It’s only shown once.
Step 5: Configure PVE Exporter
SSH into the LXC and configure the exporter:
# On grafana-stack LXC
ssh -i PATH_TO_YOUR_KEY root@192.168.100.40

# Edit PVE exporter configuration
nano /etc/prometheus-pve-exporter/pve.yml
Note the token format:
default:
  user: grafana-user@pve
  # IMPORTANT: Create a read-only user on Proxmox for monitoring
  # On Proxmox host:
  # Then add the token here:
  token_name: 'grafana-token'
  token_value: 'TOKEN_VALUE' # ⚠️ This only shows ONCE when you create it. If you lost it, make a new one.
  # OR use password:
  # password: "CHANGE_ME"
  verify_ssl: false # Self-signed cert? Set this to false or you'll get TLS errors

# Target Proxmox hosts
pve1:
  user: grafana-user@pve
  token_name: 'grafana-token'
  token_value: 'TOKEN_VALUE'
  verify_ssl: false
  target: https://192.168.100.4:8006 # Your Proxmox host IP + port 8006 (HTTPS, not HTTP!)
Lost the token? Create a new one in Proxmox.
Start the service:
# Start service
systemctl start prometheus-pve-exporter

# Verify it's actually running (not just "enabled")
root@grafana-stack:~# systemctl status prometheus-pve-exporter.service
● prometheus-pve-exporter.service - Prometheus Proxmox VE Exporter
     Loaded: loaded (/etc/systemd/system/prometheus-pve-exporter.service; enabled; preset: enabled)
     Active: active (running) since Sun 2025-11-23 11:22:06 +07; 4 days ago
 Invocation: 1c35a29336b346e8b553b74a4d8fc533
       Docs: https://github.com/prometheus-pve/prometheus-pve-exporter
   Main PID: 10509 (pve_exporter)
      Tasks: 4 (limit: 75893)
     Memory: 44.4M (peak: 45.2M)
        CPU: 27min 52.526s
     CGroup: /system.slice/prometheus-pve-exporter.service
             ├─10509 /usr/bin/python3 /usr/local/bin/pve_exporter --config.file=/etc/prometheus-pve-exporter/pve.yml --web.listen-address=0.0.0.0:9221
             └─10550 /usr/bin/python3 /usr/local/bin/pve_exporter --config.file=/etc/prometheus-pve-exporter/pve.yml --web.listen-address=0.0.0.0:9221
Look for “active (running)”. If “failed”, check verify_ssl and Proxmox IP.
Step 6: Configure Prometheus Scraping
Tell Prometheus where to scrape:
# Edit Prometheus config
nano /etc/prometheus/prometheus.yml
Add to scrape_configs:
scrape_configs:
  # ──────────────────────────────────────────────────────────────
  # Proxmox VE monitoring via pve-exporter (runs inside the LXC)
  # ──────────────────────────────────────────────────────────────
  - job_name: 'proxmox' # Friendly name shown in Prometheus/Grafana
    metrics_path: '/pve' # Endpoint where pve-exporter serves Proxmox metrics
    params:
      target:
        ['192.168.100.4:8006'] # Your Proxmox node (or cluster) + GUI port
        # Supports multiple nodes: ['node1:8006','node2:8006']
    static_configs:
      - targets: ['localhost:9221'] # Where pve-exporter is listening inside this LXC
        labels:
          service: 'proxmox-pve' # Custom label – helps filtering in Grafana
          instance: 'pve-host' # Logical name for your cluster/node
Prometheus scrapes localhost:9221/pve (the exporter), which proxies to your Proxmox API at 192.168.100.4:8006. Prometheus never talks directly to Proxmox.
Reload:
# Restart Prometheus
systemctl restart prometheus
Open http://192.168.100.40:9090/targets. The proxmox target should show UP in green:
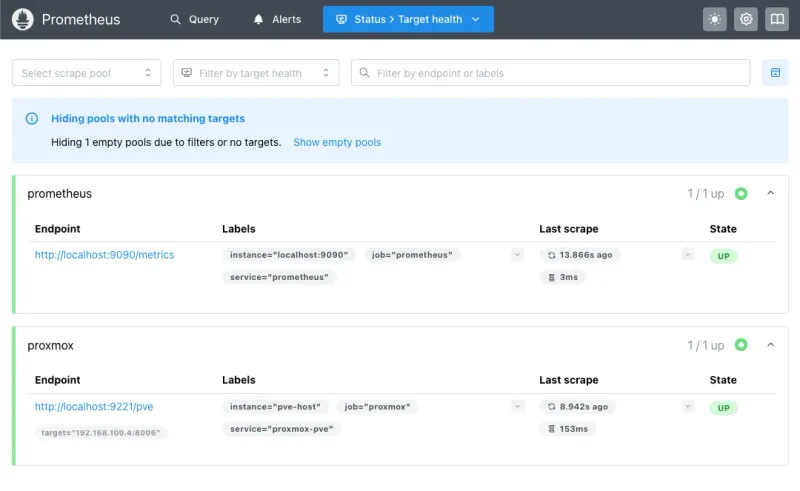
If DOWN, check the exporter service and firewall. Nothing else works until this does.
Test a query: Prometheus UI > Graph > enter pve_cpu_usage_limit > Execute:
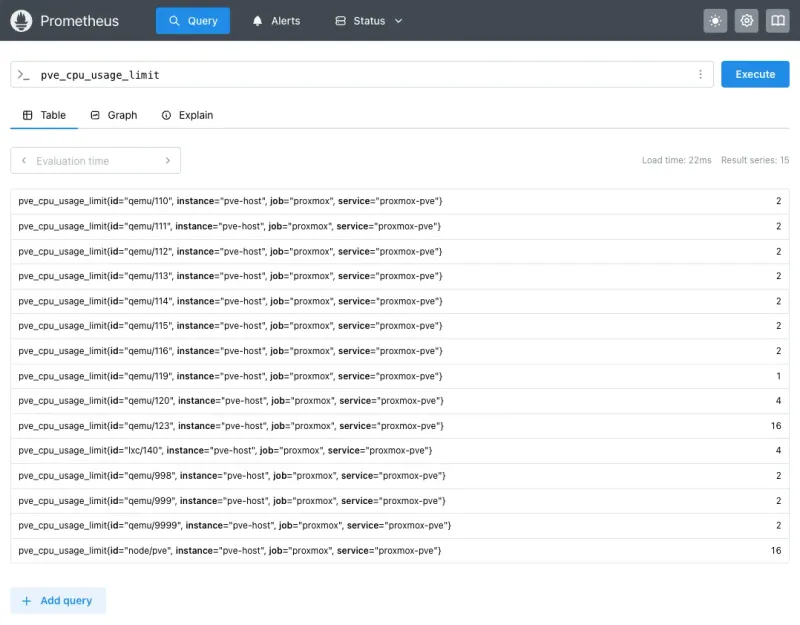
Numbers showing? Pipeline works.
Progress so far:
- Proxmox host (v9.1.1) - Read-only user
grafana-user@pvewith API token - Monitoring LXC (192.168.100.40) running:
- Grafana (v12.3.0)
- Prometheus (v3.7.3) + PVE Exporter (v3.5.5)
- AlertManager (v0.29.0)
- Loki (v3.6.0)
Zero agents on the Proxmox host. Everything uses the API.
- Change default password: Immediately change Grafana’s default
admin/admincredentials on first login - Configure firewall: Restrict access to ports 3000 (Grafana), 9090 (Prometheus), 9093 (AlertManager) to your internal network only - Use reverse proxy: For external access, deploy a reverse proxy (Nginx/Traefik) with TLS and authentication - Update API token permissions: The Proxmox API token has read-only access (PVEAuditor role), limiting exposure if compromised
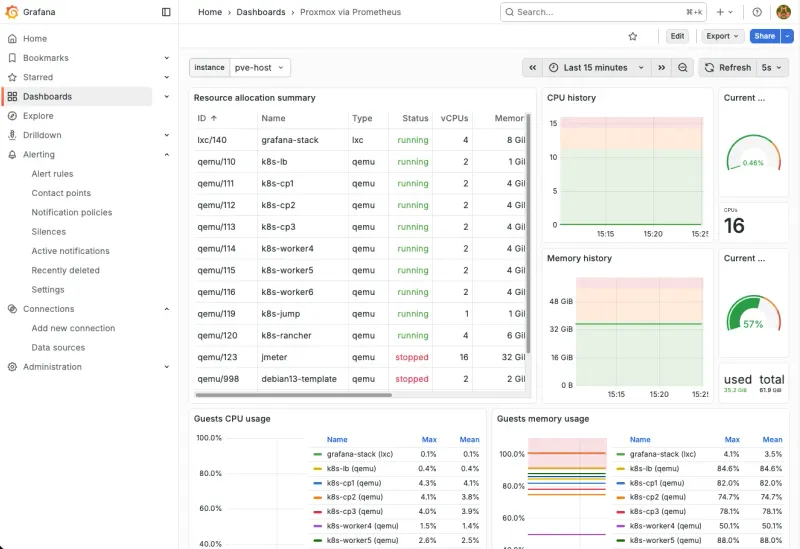
Step 7: Import Grafana Dashboard
- Open
http://192.168.100.40:3000 - Login with
admin/admin(change this immediately) - Dashboards > New > Import
- Dashboard ID:
10347 - Click Load
- Select Prometheus as datasource
- Click Import
Result:
Step 8: Set Up Alerting
Dashboards show what happened. Alerts tell you when it happens.
Step 8a: Create Notification Channels
Telegram Bot (Recommended)
- Open Telegram, search
@BotFather - Send
/newbot - Pick a name and username
- Save the Bot Token
- Start a chat with your bot (send
/start) - Get your Chat ID:
https://api.telegram.org/bot<YOUR_TOKEN>/getUpdates- Find
"chat":{"id":123456789}in the response
- Find
You need both values for the AlertManager config.
Slack Webhook (Optional)
- Go to https://api.slack.com/apps
- Create New App from scratch
- Enable Incoming Webhooks
- Add New Webhook to Workspace
- Pick your channel (e.g.,
#infrastructure-alerts) - Copy the Webhook URL
Step 8b: Configure Prometheus Alert Rules
How Alerting Works (The Quick Version)
Two components, two jobs:
Prometheus Alert Rules = What fires alerts
- Evaluates metrics every 30s against thresholds
- Attaches labels like
severity: criticalornotification_channel: telegram - Sends matching alerts to AlertManager
AlertManager = Where alerts go
- Routes alerts by label to Telegram, Slack, email, etc
- Groups similar alerts to prevent spam
- Deduplicates and silences repeats
Our setup:
- Telegram gets all alerts
- Slack optional for teams
- Two tiers: warning (80-85%) and critical (90-95%)
- Critical suppresses warning for the same metric
This setup focuses on monitoring the Proxmox host infrastructure only, not individual VMs/LXCs.
- Why this approach? It simplifies the monitoring stack and reduces complexity
- For VM/LXC monitoring: Deploy dedicated exporters (Node Exporter, application-specific exporters) inside each VM/LXC for more accurate, granular metrics
- Separation of concerns: Host-level monitoring (this guide) + VM-level monitoring (separate exporters) provides better visibility than a single solution trying to do everything

Create the alert rules:
# Create alert rules file
nano /etc/prometheus/rules/proxmox.yml
Full config for CPU, memory, disk, and storage:
groups:
  # ============================================================================
  # Group 1: Host Alerts (Critical Infrastructure)
  # ============================================================================
  - name: proxmox_host_alerts
    interval: 30s
    rules:
      # Proxmox Host Down
      - alert: ProxmoxHostDown
        expr: pve_up{id="node/pve"} == 0
        for: 1m
        labels:
          severity: critical
          component: proxmox
          alert_group: host_alerts
          notification_channel: telegram
        annotations:
          summary: '🔴 Proxmox host is down'
          description: "Proxmox host 'pve' is unreachable or down for more than 1 minute."

      # High CPU Usage
      - alert: ProxmoxHighCPU
        expr: pve_cpu_usage_ratio{id="node/pve"} > 0.85
        for: 5m
        labels:
          severity: warning
          component: proxmox
          alert_group: host_alerts
          notification_channel: telegram
        annotations:
          summary: '⚠️ High CPU usage on Proxmox host'
          description: 'CPU usage is {{ $value | humanizePercentage }} on Proxmox host (threshold: 85%).'

      # Critical CPU Usage
      - alert: ProxmoxCriticalCPU
        expr: pve_cpu_usage_ratio{id="node/pve"} > 0.95
        for: 2m
        labels:
          severity: critical
          component: proxmox
          alert_group: host_alerts
          notification_channel: telegram
        annotations:
          summary: '🔴 CRITICAL CPU usage on Proxmox host'
          description: 'CPU usage is {{ $value | humanizePercentage }} on Proxmox host (threshold: 95%).'

      # High Memory Usage
      - alert: ProxmoxHighMemory
        expr: (pve_memory_usage_bytes{id="node/pve"} / pve_memory_size_bytes{id="node/pve"}) > 0.85
        for: 5m
        labels:
          severity: warning
          component: proxmox
          alert_group: host_alerts
          notification_channel: telegram
        annotations:
          summary: '⚠️ High memory usage on Proxmox host'
          description: 'Memory usage is {{ $value | humanizePercentage }} on Proxmox host (threshold: 85%).'

      # Critical Memory Usage
      - alert: ProxmoxCriticalMemory
        expr: (pve_memory_usage_bytes{id="node/pve"} / pve_memory_size_bytes{id="node/pve"}) > 0.95
        for: 2m
        labels:
          severity: critical
          component: proxmox
          alert_group: host_alerts
          notification_channel: telegram
        annotations:
          summary: '🔴 CRITICAL memory usage on Proxmox host'
          description: 'Memory usage is {{ $value | humanizePercentage }} on Proxmox host (threshold: 95%).'

      # High Disk Usage
      - alert: ProxmoxHighDiskUsage
        expr: (pve_disk_usage_bytes{id="node/pve"} / pve_disk_size_bytes{id="node/pve"}) > 0.80
        for: 10m
        labels:
          severity: warning
          component: proxmox
          alert_group: host_alerts
          notification_channel: telegram
        annotations:
          summary: '⚠️ High disk usage on Proxmox host'
          description: 'Disk usage is {{ $value | humanizePercentage }} on Proxmox host (threshold: 80%).'

      # Critical Disk Usage
      - alert: ProxmoxCriticalDiskUsage
        expr: (pve_disk_usage_bytes{id="node/pve"} / pve_disk_size_bytes{id="node/pve"}) > 0.90
        for: 5m
        labels:
          severity: critical
          component: proxmox
          alert_group: host_alerts
          notification_channel: telegram
        annotations:
          summary: '🔴 CRITICAL disk usage on Proxmox host'
          description: 'Disk usage is {{ $value | humanizePercentage }} on Proxmox host (threshold: 90%).'

  # Group 2: Storage Alerts (Telegram - Operational Alerts)
  - name: proxmox_storage_alerts
    interval: 1m
    rules:
      # Storage Pool High Usage
      - alert: ProxmoxStorageHighUsage
        expr: (pve_disk_usage_bytes{id=~"storage/.*"} / pve_disk_size_bytes{id=~"storage/.*"}) > 0.80
        for: 10m
        labels:
          severity: warning
          component: proxmox
          alert_group: storage_alerts
          notification_channel: telegram
        annotations:
          summary: '⚠️ High usage on storage {{ $labels.storage }}'
          description: "Storage '{{ $labels.storage }}' usage is {{ $value | humanizePercentage }} (threshold: 80%)."

      # Storage Pool Critical Usage
      - alert: ProxmoxStorageCriticalUsage
        expr: (pve_disk_usage_bytes{id=~"storage/.*"} / pve_disk_size_bytes{id=~"storage/.*"}) > 0.90
        for: 5m
        labels:
          severity: critical
          component: proxmox
          alert_group: storage_alerts
          notification_channel: telegram
        annotations:
          summary: '🔴 CRITICAL usage on storage {{ $labels.storage }}'
          description: "Storage '{{ $labels.storage }}' usage is {{ $value | humanizePercentage }} (threshold: 90%)."
Step 8c: Configure AlertManager Routing
nano /etc/alertmanager/alertmanager.ymlglobal:
resolve_timeout: 5m
# Routing tree - directs alerts to receivers based on labels
route:
# Default grouping and timing
group_by: ['alertname', 'severity', 'alert_group']
group_wait: 10s # Wait before sending first notification
group_interval: 10s # Wait before sending notifications for new alerts in group
repeat_interval: 12h # Resend notification every 12 hours if still firing
# Default receiver for unmatched alerts
receiver: 'telegram-default'
# Child routes - matched in order, first match wins
routes:
# Route 1: Slack for host_alerts (critical infrastructure)
- match:
notification_channel: slack
receiver: 'slack-channel'
group_wait: 10s
group_interval: 10s
repeat_interval: 1h # Repeat every hour for critical infrastructure
continue: false # Stop matching after this route
# Route 2: Telegram for telegram channel alerts (storage)
- match:
notification_channel: telegram
receiver: 'telegram-operational'
group_wait: 30s
group_interval: 30s
repeat_interval: 2h # Repeat every 2 hours for operational alerts
continue: false
# Notification receivers
receivers:
# Slack receiver for critical infrastructure (host alerts)
- name: 'slack-channel'
slack_configs:
- api_url: 'SLACK_WEBHOOK'
channel: '#alerts-test'
username: 'Prometheus AlertManager'
icon_emoji: ':warning:'
title: '{{ .GroupLabels.alertname }} - {{ .GroupLabels.severity | toUpper }}'
text: |
{{ range .Alerts }}
*Alert:* {{ .Labels.alertname }}
*Severity:* {{ .Labels.severity }}
*Component:* {{ .Labels.component }}
*Summary:* {{ .Annotations.summary }}
*Description:* {{ .Annotations.description }}
{{ end }}
send_resolved: true
# Optional: Mention users for critical alerts
# color: '{{ if eq .Status "firing" }}danger{{ else }}good{{ end }}'
# Telegram receiver for operational alerts (storage)
- name: 'telegram-operational'
telegram_configs:
- bot_token: 'BOT_TOKEN'
chat_id: CHAT_ID_NUMBERS
parse_mode: 'HTML'
message: |
{{ range .Alerts }}
<b>{{ .Labels.severity | toUpper }}: {{ .Labels.alertname }}</b>
{{ .Annotations.summary }}
<b>Details:</b>
{{ .Annotations.description }}
<b>Component:</b> {{ .Labels.component }}
<b>Group:</b> {{ .Labels.alert_group }}
<b>Status:</b> {{ .Status }}
{{ end }}
send_resolved: true
# Default Telegram receiver (fallback)
- name: 'telegram-default'
telegram_configs:
- bot_token: 'BOT_TOKEN'
chat_id: CHAT_ID_NUMBERS
parse_mode: 'HTML'
message: |
{{ range .Alerts }}
<b>{{ .Labels.severity | toUpper }}: {{ .Labels.alertname }}</b>
{{ .Annotations.summary }}
{{ .Annotations.description }}
<b>Component:</b> {{ .Labels.component }}
{{ end }}
send_resolved: true
# Inhibition rules - suppress alerts based on other alerts
inhibit_rules:
# If critical alert is firing, suppress warning alerts for same component
- source_match:
severity: 'critical'
target_match:
severity: 'warning'
equal: ['component', 'alertname']Validate before reloading. A typo breaks everything:
# Validate configs (do this FIRST!)
promtool check rules /etc/prometheus/rules/proxmox.yml
amtool check-config /etc/alertmanager/alertmanager.yml
# If validation passed, reload
curl -X POST http://localhost:9090/-/reload
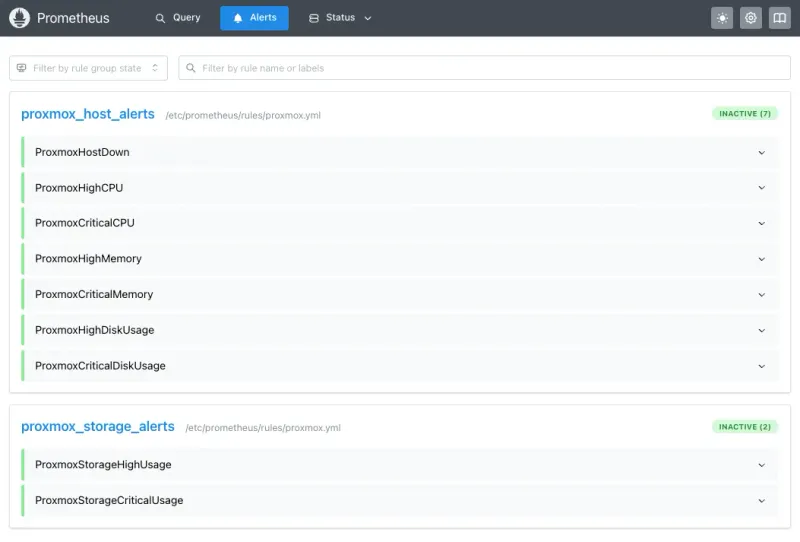
systemctl restart alertmanagerVerify at http://192.168.100.40:9090/alerts. All rules should be listed:
Step 9: Test Alerts
Don’t skip this. Verify routing before you need it.
# Test Slack alert (if you set it up)
curl -X POST http://localhost:9093/api/v2/alerts \
-H "Content-Type: application/json" \
-d '[{
"labels": {
"alertname": "TestSlack",
"notification_channel": "slack",
"severity": "warning"
},
"annotations": {
"summary": "Test Slack Alert",
"description": "This is a test alert sent manually to verify Slack routing"
}
}]'
# Test Telegram alert
curl -X POST http://localhost:9093/api/v2/alerts \
-H "Content-Type: application/json" \
-d '[
{
"labels": {
"alertname": "TestTelegram",
"notification_channel": "telegram",
"severity": "warning"
},
"annotations": {
"summary": "Test Telegram Alert",
"description": "This is a test"
}
}
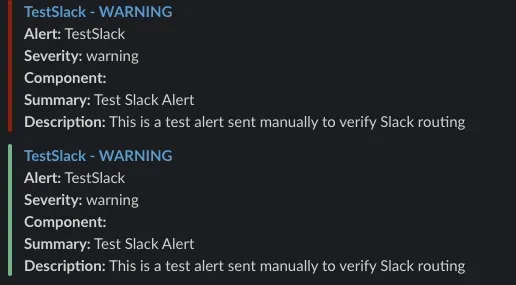
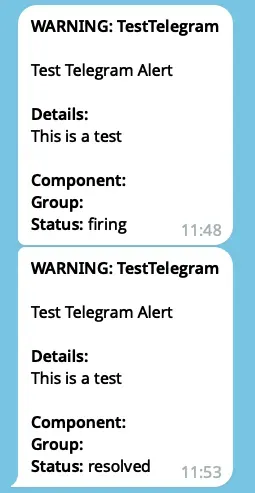
]'You should see messages within 10-30 seconds:
Troubleshooting Common Issues
PVE Exporter Won’t Start / Shows “Not Configured”
Check in order:
-
Config file missing
cat /etc/prometheus-pve-exporter/pve.yml # If you get "No such file", well... there's your problem -
Wrong API token format
- Use:
token_name: "grafana-token"andtoken_value: "8a7b6c5d-1234-5678..." - Not the full
PVEAPIToken=user@pve!token=valuestring
- Use:
-
Can’t reach Proxmox
curl -k https://192.168.100.4:8006/api2/json/nodes \ -H "Authorization: PVEAPIToken=grafana-user@pve!grafana-token=YOUR_TOKEN" # Should return JSON. Timeout = network/firewall issue -
Check logs
journalctl -u prometheus-pve-exporter -f
Prometheus Target Shows “Context Deadline Exceeded”
Prometheus can’t scrape in time. Usually network or SSL.
-
Firewall blocking port 8006
# From inside LXC curl -k https://192.168.100.4:8006 # Timeout = firewall -
SSL issues - Set
verify_ssl: falsein pve.yml for self-signed certs -
Slow scraping - Increase timeout:
scrape_configs:
  - job_name: 'proxmox'
    scrape_timeout: 30s # Bump from default 10s
Grafana Shows “No Data” on Dashboard
-
Check Prometheus connection
- Grafana > Configuration > Data Sources > Prometheus > Test
- Should say “Data source is working”
-
Check metrics
- Open
http://192.168.100.40:9090, querypve_up - Should return
1
- Open
-
Time range - Set to “Last 15 minutes” if you just started collecting
Alerts Configured But Nothing Happens
-
Check alert state at
http://192.168.100.40:9090/alerts- Green = inactive
- Yellow = pending (waiting for “for” duration)
- Red = firing
-
Check AlertManager
curl http://localhost:9093/api/v2/alerts -
Check logs
journalctl -u alertmanager -f -
Run manual test from Step 9. If that fails, your Telegram token or Slack webhook is wrong.
Permission Denied / 403 Errors from Proxmox API
-
Wrong permissions
# On Proxmox host pveum user permission list grafana-user@pve # Should show "PVEAuditor" role on path "/" -
Token invalidated (happens after Proxmox updates)
pveum user token remove grafana-user@pve grafana-token pveum user token add grafana-user@pve grafana-token --privsep 0 # Update pve.yml with the new value -
Token expired - Check Proxmox UI (Datacenter > Permissions > API Tokens) for expiration
Monitoring Metrics
Key metrics available:
Host Metrics:
pve_cpu_usage_ratio- CPU usage (0-1)pve_memory_usage_bytes/pve_memory_size_bytes- Memory usagepve_disk_usage_bytes/pve_disk_size_bytes- Disk usagepve_up{id="node/pve"}- Host availability
Storage Metrics:
pve_disk_usage_bytes{id=~"storage/.*"}- Storage pool usagepve_storage_info- Storage pool info
Alert Rules Summary
| Alert | Threshold | Duration | Channel | Severity |
|---|---|---|---|---|
| Host Alerts (Telegram - Critical Infrastructure) | ||||
| ProxmoxHostDown | == 0 | 1 min | Telegram | Critical |
| ProxmoxHighCPU | >85% | 5 min | Telegram | Warning |
| ProxmoxCriticalCPU | >95% | 2 min | Telegram | Critical |
| ProxmoxHighMemory | >85% | 5 min | Telegram | Warning |
| ProxmoxCriticalMemory | >95% | 2 min | Telegram | Critical |
| ProxmoxHighDiskUsage | >80% | 10 min | Telegram | Warning |
| ProxmoxCriticalDiskUsage | >90% | 5 min | Telegram | Critical |
| Storage Alerts (Telegram - Operational) | ||||
| ProxmoxStorageHighUsage | >80% | 10 min | Telegram | Warning |
| ProxmoxStorageCriticalUsage | >90% | 5 min | Telegram | Critical |
The Bottom Line
You now have:
- Grafana dashboards with real-time Proxmox metrics
- Telegram alerts that fire before things break
- Full monitoring with zero agents on the host
All in a single 8GB LXC.
Next steps:
- Tune alert thresholds for your workload
- Add storage pools by copying alert rules
- Set up a reverse proxy with SSL for external Grafana access
- Add VM/LXC monitoring with dedicated exporters (separate guide)
Re-run test alerts (Step 9) periodically to confirm everything works.